01 / MECHANICS
Aggressive buying & selling
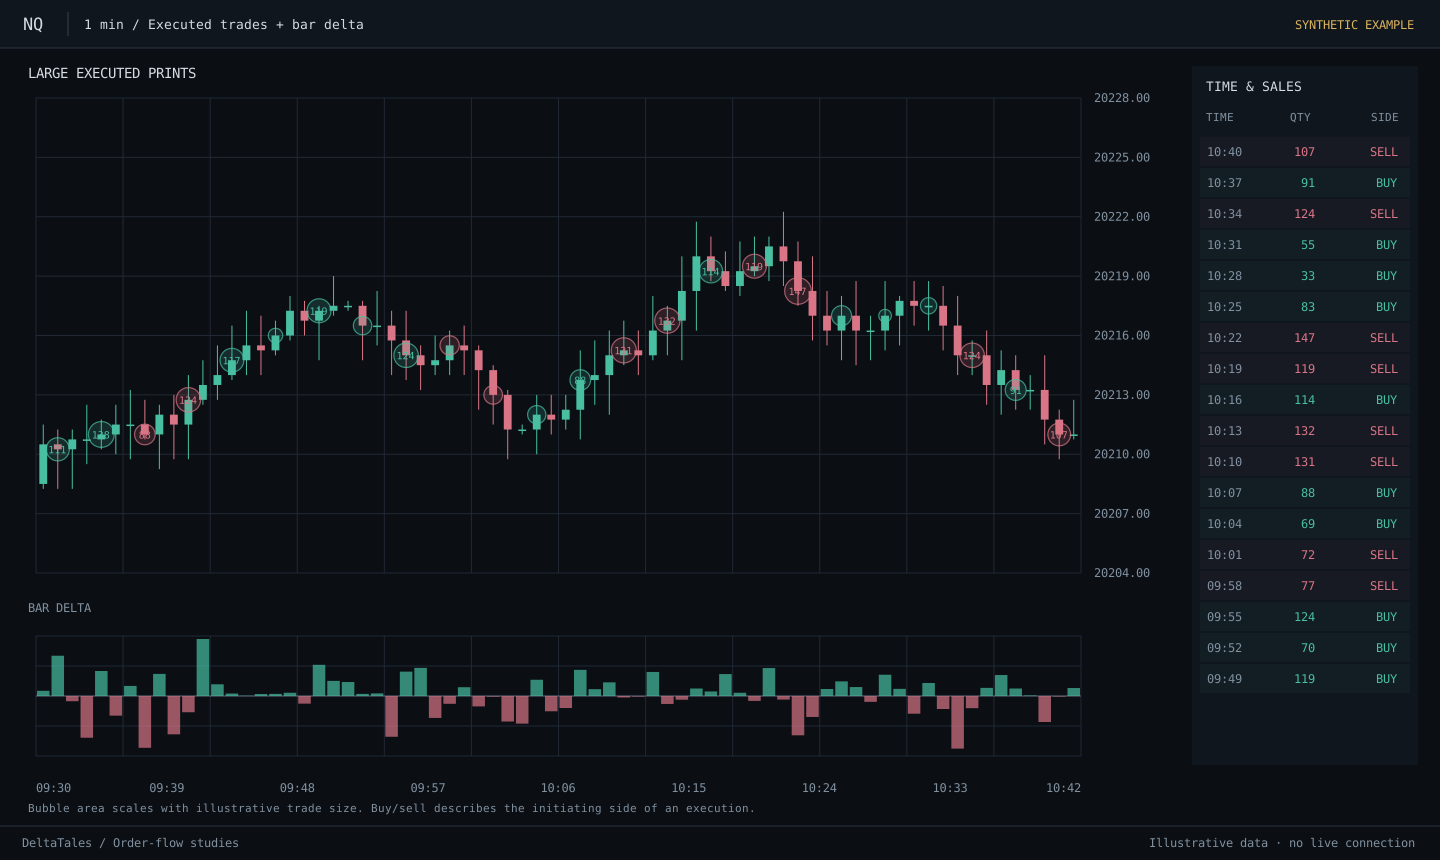
Every executed trade has both sides. “Aggressive” describes the side that takes available liquidity: buying into an offer or selling into a bid.
Databento · trade-side definitions
LOOK BENEATH THE CANDLE
Price is the headline.
Order flow is the story underneath.
A clearer lens on buying, selling and the way price responds. Built for curious minds who want to understand the auction.
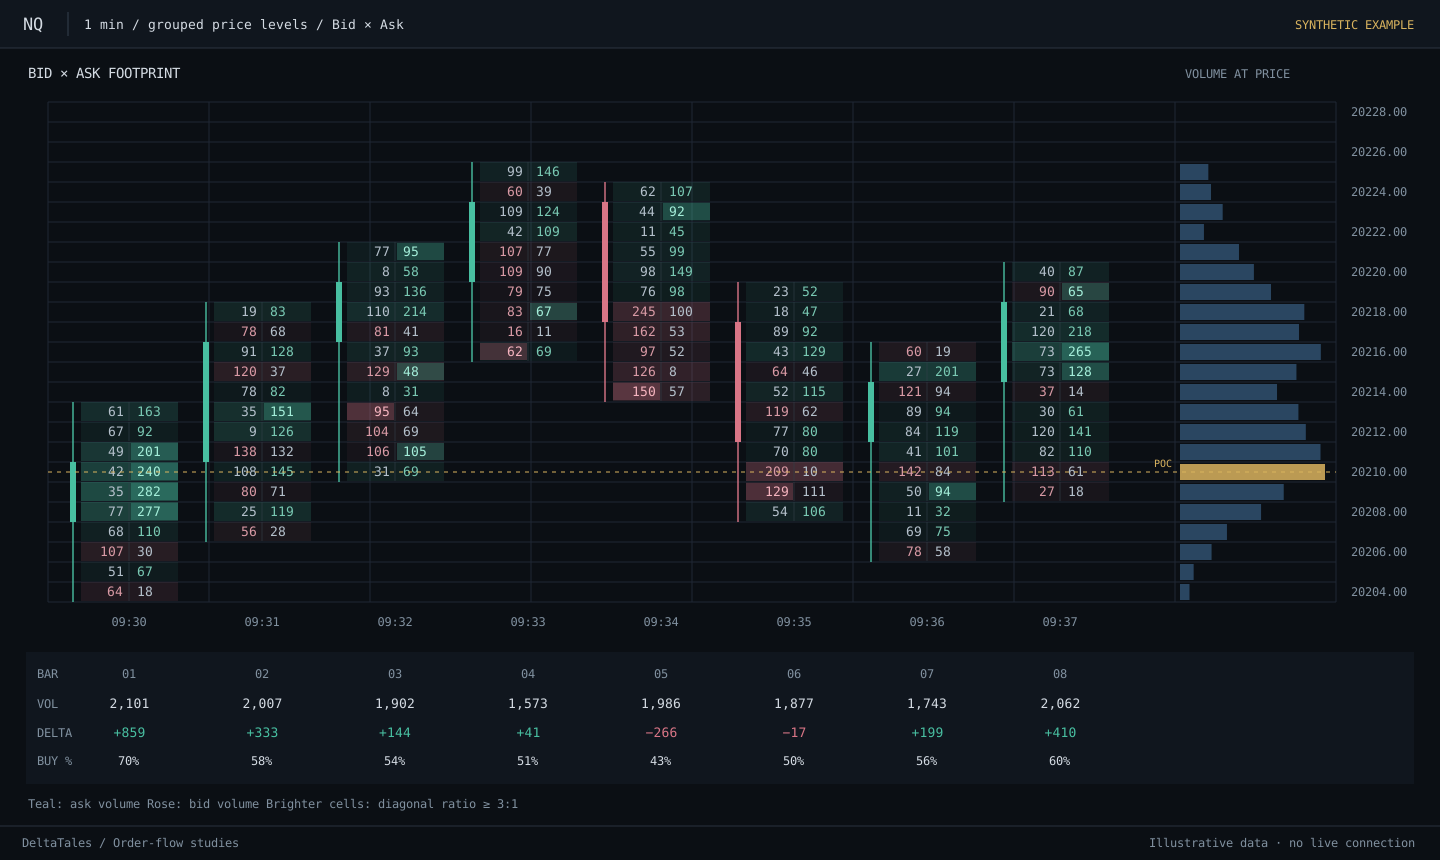
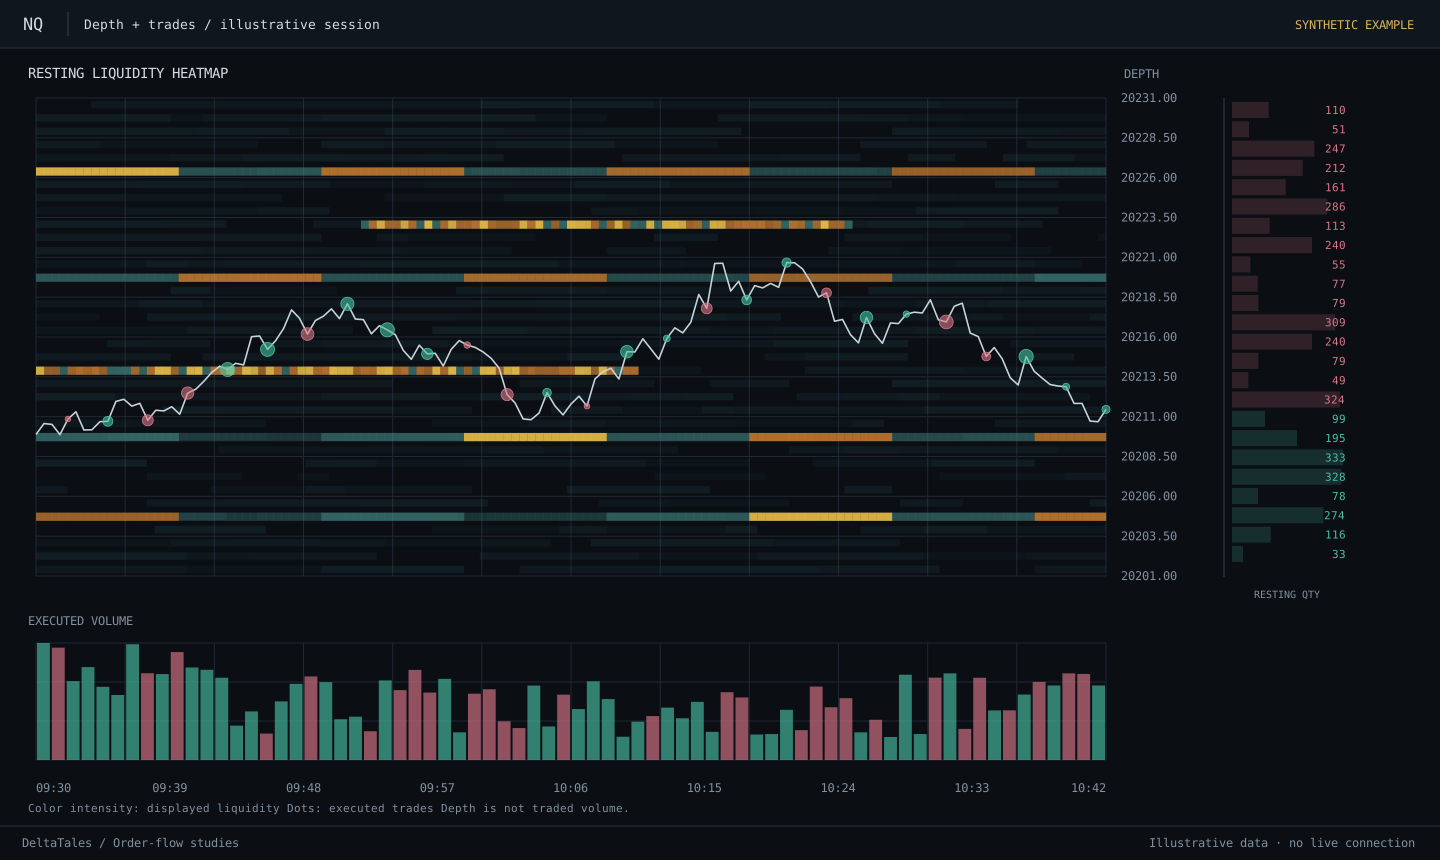
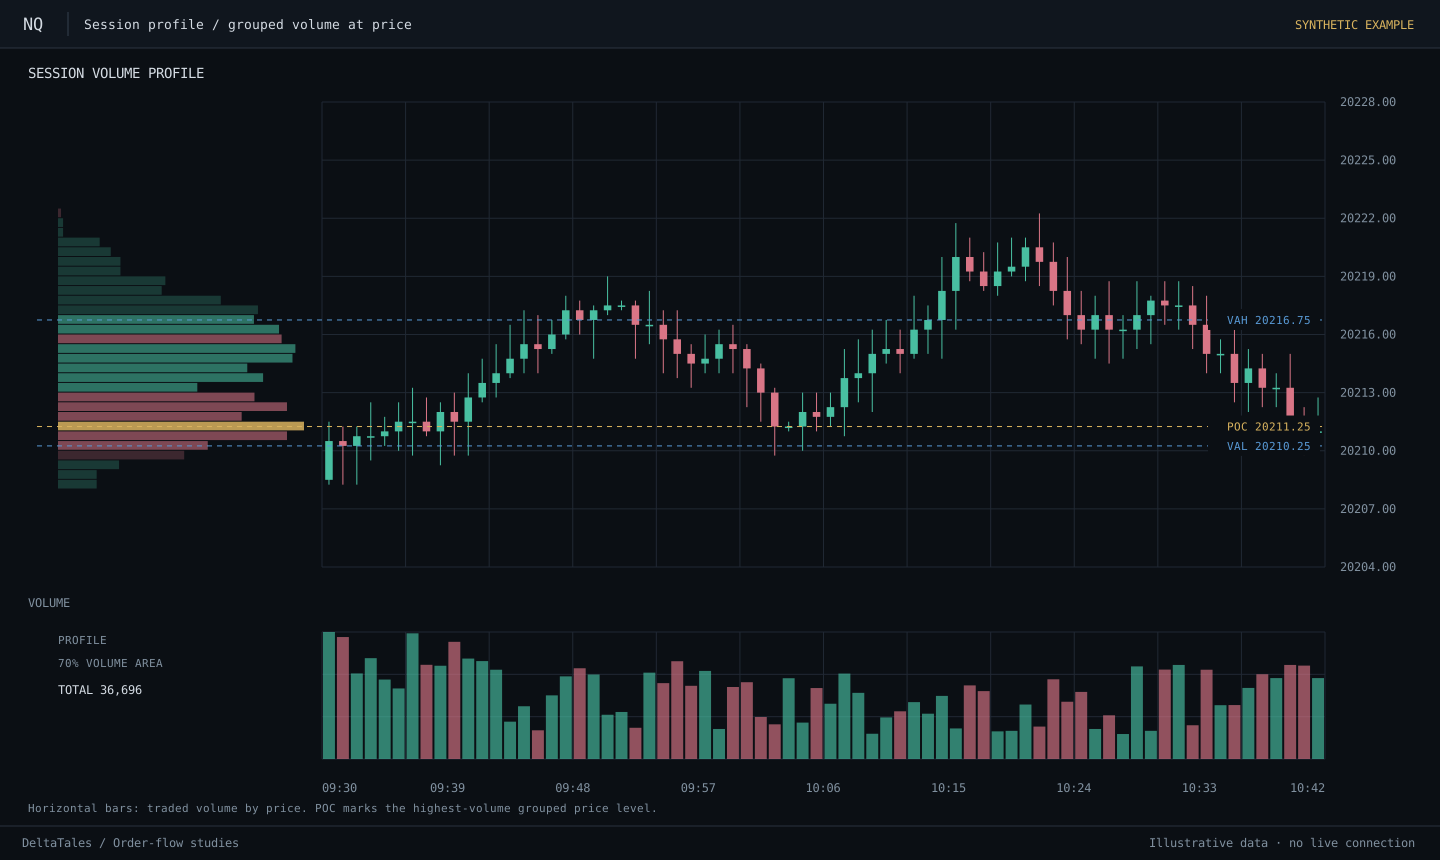
Bid × ask at every price.Grouped traded volume, bar delta and a volume profile.
THE DELTATALES PERSPECTIVE
Observe the activity.Read the response.Respect the uncertainty.01 — THE LENS
A candle compresses a market into four prices. Order flow adds another layer: who crossed the spread, how much traded, and where activity concentrated.
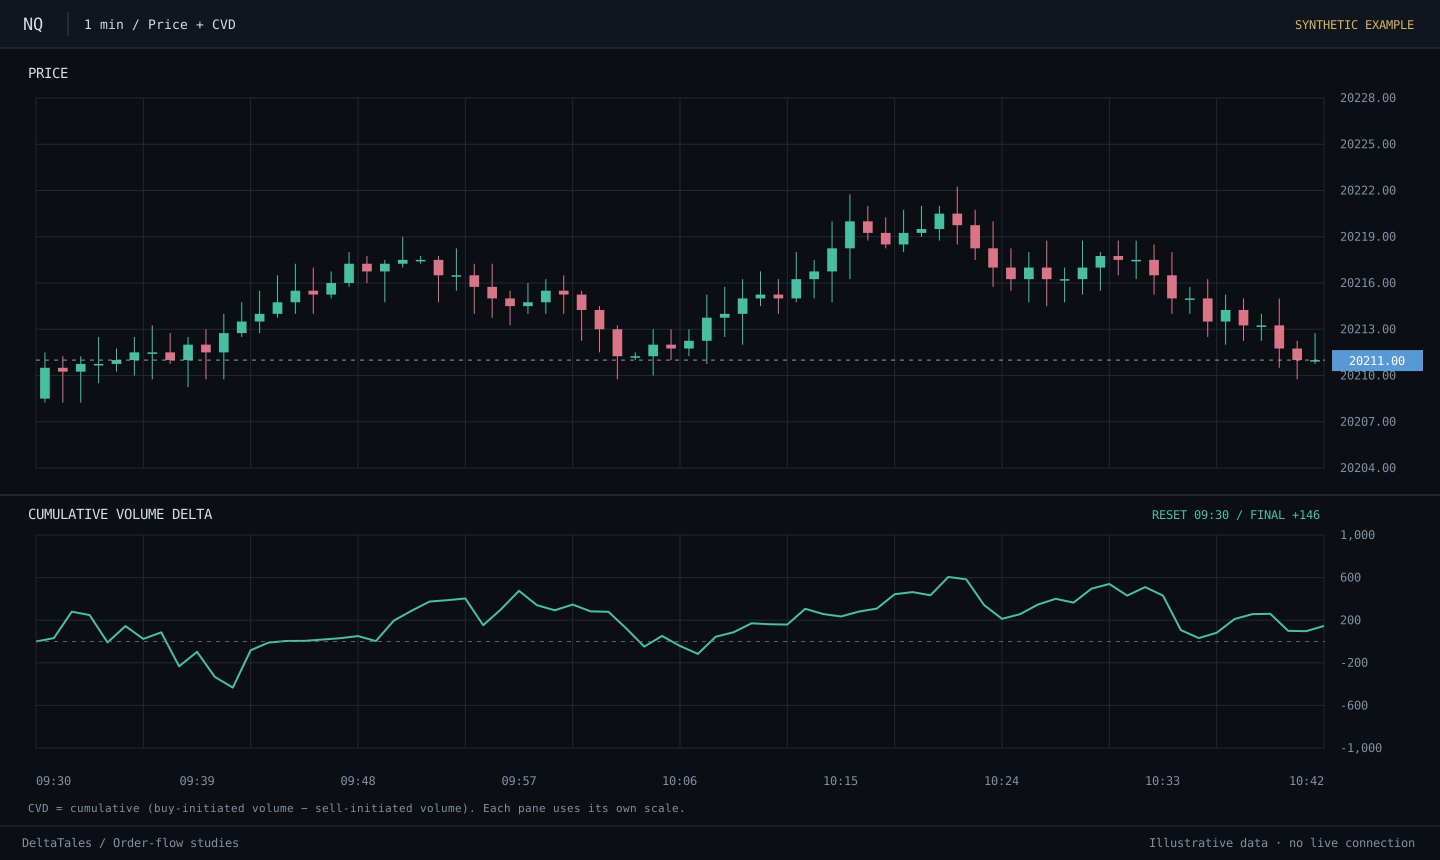
Market delta is buy-initiated volume minus sell-initiated volume over a chosen interval. It describes executed pressure, not the number of buyers and sellers.
Aggressive buying accompanies a rising schematic price path. Continuation still needs evidence.
Read the calculation reference ↗Invented quantities for learning. No feed, forecast or performance result.
02 — THE FIELD GUIDE
Six ideas that make order flow easier to read. Start with the mechanics, then add context.
Every executed trade has both sides. “Aggressive” describes the side that takes available liquidity: buying into an offer or selling into a bid.
Databento · trade-side definitionsBuy-initiated volume minus sell-initiated volume. A positive value means more volume initiated by buyers; it does not mean price must rise.
Sierra Chart · delta calculationCVD adds each interval’s delta to a running total. The starting point, session reset and trade classification matter when comparing charts.
Sierra Chart · cumulative deltaA footprint opens the bar to show traded volume at individual prices. Volume at price shows where trading occurred; it is different from resting depth.
Sierra Chart · Numbers BarsAggressive trades meet passive liquidity with limited price progress. This can suggest absorption, but the observation alone does not establish a reversal.
Bookmap · absorption explainedA flow pattern is evidence to examine. A trading signal requires explicit rules, validation and risk controls. One compelling example is not a tested edge.
How we think about researchReferences explain market mechanics. They do not imply endorsement of DeltaTales.
03 — OUR APPROACH
DeltaTales is an independent order-flow research and software project. Our starting point is simple: understand what traded before deciding what it might mean.
Research begins with actual NQ E-mini Nasdaq-100 futures trade data. Data quality, aggressor classification and session boundaries come before interpretation.
Read delta alongside price, location and participation. Strong aggression with little movement asks a different question from aggression with sustained progress.
Separate an observed pattern from a validated rule. Make assumptions explicit, test carefully, and leave room for the market to disagree.
THE NEXT CHAPTER
The public field guide is here to explore. The DeltaTales analytics application is in development, with no public launch date yet.
Start with the field guideThis website offers education and an illustrative explainer. It does not provide trading signals or account connectivity.
A LITTLE MORE CONTEXT
No. This is the public educational website for a research project in development. All visuals on this page are synthetic illustrations. There is no live data connection, public trading dashboard or order execution here.
Order flow describes trading activity. Its interpretation depends on context and data quality. Positive delta can coexist with falling prices, and absorption does not guarantee a reversal. Any proposed predictive rule needs independent testing.
No. The research context here is exchange-traded NQ futures. A broker’s NAS100 CFD is a different instrument, with its own prices, liquidity and execution conditions. Futures flow should not be described as that CFD’s own order book.
Different data coverage, trade-side classification, aggregation, filters and session resets can change the result. The explorer uses explicitly invented, fully classified quantities and resets CVD to zero before the first interval.
The explainer runs in your browser without account creation, forms, analytics trackers or cookies. It does not send your selections to a server. The hosting server may retain ordinary request logs.